4. Working with Data#
In addition to what’s in Anaconda, this lecture needs the following library:
!pip install --upgrade wbgapi
4.1. Overview#
pandas is the standard library for working with tables of data in Python.
AI tools are trained on masses of pandas code, and most of what you do with AI and data in Python will involve substantial amounts of it.
As such, we at least need to understand the basics.
Just as NumPy provides the basic array data type plus core array operations, pandas
defines fundamental structures for working with data and
endows them with methods that facilitate operations such as
reading in data
adjusting indices
working with dates and time series
sorting, grouping, re-ordering and general data munging [1]
dealing with missing values, etc., etc.
Note
pandas does not contain sophisticated statistical routines.
Rather, it is a tool for simple data analysis and a foundation for many other packages that work with pandas DataFrames, such as statsmodels and scikit-learn.
This lecture gives a fast-paced introduction to pandas.
We use the following imports.
import pandas as pd
import numpy as np
import matplotlib.pyplot as plt
from matplotlib.patches import FancyBboxPatch, Rectangle
4.2. Series#
Two important data types defined by pandas are Series and DataFrame.
You can think of a Series as a “column” of data, such as a collection of observations on a single variable.
A DataFrame is like a Series but it has multiple columns – analogous to a spreadsheet.
Let’s start with Series.
We begin by creating a series from a Python dictionary.
The keys are the ticker symbols of four listed companies, and the values are made-up daily returns on their shares, in percent.
returns = {'AMZN': 1.2, 'AAPL': -0.7, 'MSFT': 0.4, 'GOOG': -1.5}
s = pd.Series(returns, name='daily returns')
s
AMZN    1.2
AAPL   -0.7
MSFT    0.4
GOOG   -1.5
Name: daily returns, dtype: float64
The keys have become the index of the series.
Let’s compare this with a NumPy array containing the same numbers.
a = s.to_numpy()
a
array([ 1.2, -0.7, 0.4, -1.5])
The figure below shows the two side by side.
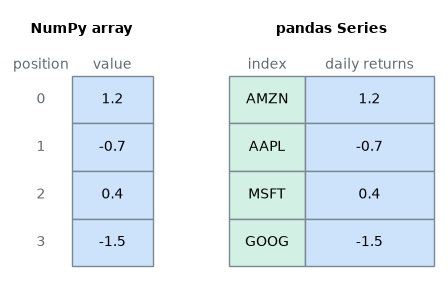
Fig. 4.1 A NumPy array and a pandas Series#
We find a number in a NumPy array by its position.
print(a[0])
1.2
In a pandas series, we typically use its label.
print(s['AMZN'])
1.2
Series are built on top of NumPy arrays and support many similar operations.
For example, we can convert the returns from percentages to fractions.
s / 100
AMZN    0.012
AAPL   -0.007
MSFT    0.004
GOOG   -0.015
Name: daily returns, dtype: float64
We can also use NumPy functions
np.abs(s)
AMZN    1.2
AAPL    0.7
MSFT    0.4
GOOG    1.5
Name: daily returns, dtype: float64
But Series provide more than NumPy arrays.
For one thing, they have some additional (statistically oriented) methods
s.describe()
count    4.000000
mean    -0.150000
std      1.190238
min     -1.500000
25%     -0.900000
50%     -0.150000
75%      0.600000
max      1.200000
Name: daily returns, dtype: float64
And because of the index, Series are like Python dictionaries
(with the restriction that the items in the dictionary all have the same
type—in this case, floats).
In fact, you can use much of the same syntax as Python dictionaries
s['AMZN'] = 0
s
AMZN    0.0
AAPL   -0.7
MSFT    0.4
GOOG   -1.5
Name: daily returns, dtype: float64
'AAPL' in s
True
4.3. DataFrames#
While a Series is a single column of data, a DataFrame is several columns, one for each variable.
It is used to manage and analyze data that are naturally viewed as rows and columns.
Let’s look at an example that reads data from the CSV file gdp_population_by_country_2000.csv.
It holds data on seven countries in the year 2000, in the layout of the Penn World Tables.
The numbers are for illustration only, since they do not match any downloadable release of those tables.
The dataset contains the following indicators
Variable Name |
Description |
|---|---|
POP |
Population (in thousands) |
tcgdp |
GDP (millions of international dollars) |
cc |
Consumption Share of GDP Per Capita (%) |
cg |
Government Consumption Share of GDP Per Capita (%) |
We’ll read this in from a URL using the pandas function read_csv.
url = ('https://github.com/QuantEcon/data-lectures/raw/main/lectures/'
       'gdp_population_by_country_2000.csv')
df = pd.read_csv(url)
type(df)
pandas.DataFrame
Here’s the content of the file
df
| country | POP | tcgdp | cc | cg | |
|---|---|---|---|---|---|
| 0 | Argentina | 37335.653 | 2.950722e+05 | 75.716805 | 5.578804 |
| 1 | Australia | 19053.186 | 5.418047e+05 | 67.759026 | 6.720098 |
| 2 | India | 1006300.297 | 1.728144e+06 | 64.575551 | 14.072206 |
| 3 | Israel | 6114.570 | 1.292539e+05 | 64.436451 | 10.266688 |
| 4 | Malawi | 11801.505 | 5.026222e+03 | 74.707624 | 11.658954 |
| 5 | South Africa | 45064.098 | 2.272424e+05 | 72.718710 | 5.726546 |
| 6 | United States | 282171.957 | 9.898700e+06 | 72.347054 | 6.032454 |
The leftmost column, 0, 1, ..., 6, is the index of the DataFrame.
It is not in the file: pandas created it because the file does not supply one, and you will see this often when reading CSV files.
The country names make a more useful index, so let’s use them instead.
df = df.set_index('country')
df
| POP | tcgdp | cc | cg | |
|---|---|---|---|---|
| country | ||||
| Argentina | 37335.653 | 2.950722e+05 | 75.716805 | 5.578804 |
| Australia | 19053.186 | 5.418047e+05 | 67.759026 | 6.720098 |
| India | 1006300.297 | 1.728144e+06 | 64.575551 | 14.072206 |
| Israel | 6114.570 | 1.292539e+05 | 64.436451 | 10.266688 |
| Malawi | 11801.505 | 5.026222e+03 | 74.707624 | 11.658954 |
| South Africa | 45064.098 | 2.272424e+05 | 72.718710 | 5.726546 |
| United States | 282171.957 | 9.898700e+06 | 72.347054 | 6.032454 |
The country names are now the index, and country is no longer one of the columns.
The figure below shows the parts of this DataFrame.
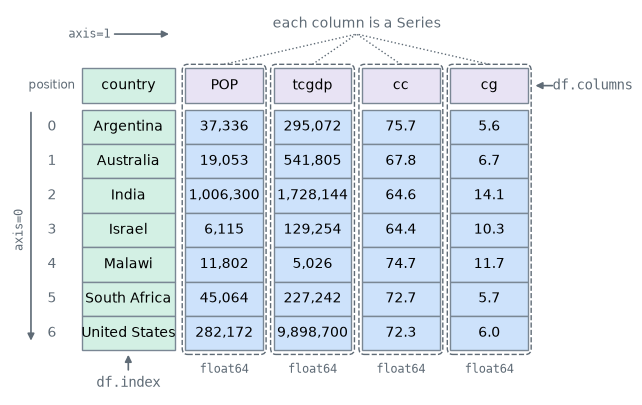
Fig. 4.2 The parts of a DataFrame#
Each column is a Series with its own data type, and all the columns share the same index.
This figure, the earlier comparison of an array and a Series, and the merge figure below follow the diagrams in Lev Maximov’s Pandas Illustrated, which is a good visual guide to the library.
4.3.1. A first look at a dataset#
Seven rows fit on the screen, but most real datasets do not.
So the first step with a new dataset is usually to run a few standard checks.
The shape attribute gives the number of rows and columns.
df.shape
(7, 4)
The head method shows the first few rows.
df.head(3)
| POP | tcgdp | cc | cg | |
|---|---|---|---|---|
| country | ||||
| Argentina | 37335.653 | 2.950722e+05 | 75.716805 | 5.578804 |
| Australia | 19053.186 | 5.418047e+05 | 67.759026 | 6.720098 |
| India | 1006300.297 | 1.728144e+06 | 64.575551 | 14.072206 |
The info method lists each column with its data type and its number of non-missing values.
df.info()
<class 'pandas.DataFrame'>
Index: 7 entries, Argentina to United States
Data columns (total 4 columns):
 #   Column  Non-Null Count  Dtype
---  ------  --------------  -----
 0   POP     7 non-null      float64
 1   tcgdp   7 non-null      float64
 2   cc      7 non-null      float64
 3   cg      7 non-null      float64
dtypes: float64(4)
memory usage: 340.0 bytes
The describe method gives summary statistics for each numeric column.
df.describe()
| POP | tcgdp | cc | cg | |
|---|---|---|---|---|
| count | 7.000000e+00 | 7.000000e+00 | 7.000000 | 7.000000 |
| mean | 2.011202e+05 | 1.832178e+06 | 70.323032 | 8.579393 |
| std | 3.681215e+05 | 3.603739e+06 | 4.697746 | 3.405579 |
| min | 6.114570e+03 | 5.026222e+03 | 64.436451 | 5.578804 |
| 25% | 1.542735e+04 | 1.782481e+05 | 66.167289 | 5.879500 |
| 50% | 3.733565e+04 | 2.950722e+05 | 72.347054 | 6.720098 |
| 75% | 1.636180e+05 | 1.134975e+06 | 73.713167 | 10.962821 |
| max | 1.006300e+06 | 9.898700e+06 | 75.716805 | 14.072206 |
These checks catch many problems early, such as a column of numbers that was read in as text.
4.3.2. Select data by position and label#
In practice, one thing that we do all the time is to find, select and work with a subset of the data of our interests.
To select rows and columns by position, the iloc attribute should be used with the format .iloc[rows, columns].
df.iloc[2:5, 0:2]
| POP | tcgdp | |
|---|---|---|
| country | ||
| India | 1006300.297 | 1.728144e+06 |
| Israel | 6114.570 | 1.292539e+05 |
| Malawi | 11801.505 | 5.026222e+03 |
To select rows and columns by label, the loc attribute can be used in a similar way
df.loc[['India', 'Israel', 'Malawi'], ['POP', 'tcgdp']]
| POP | tcgdp | |
|---|---|---|
| country | ||
| India | 1006300.297 | 1.728144e+06 |
| Israel | 6114.570 | 1.292539e+05 |
| Malawi | 11801.505 | 5.026222e+03 |
We can also use it to pick out a single number
print(df.loc['India', 'POP'])
1006300.297
To select whole columns, we can pass a list containing their names
df[['POP', 'tcgdp']]
| POP | tcgdp | |
|---|---|---|
| country | ||
| Argentina | 37335.653 | 2.950722e+05 |
| Australia | 19053.186 | 5.418047e+05 |
| India | 1006300.297 | 1.728144e+06 |
| Israel | 6114.570 | 1.292539e+05 |
| Malawi | 11801.505 | 5.026222e+03 |
| South Africa | 45064.098 | 2.272424e+05 |
| United States | 282171.957 | 9.898700e+06 |
A single column is a Series, with the same index as the DataFrame
df['POP']
country
Argentina          37335.653
Australia          19053.186
India            1006300.297
Israel              6114.570
Malawi             11801.505
South Africa       45064.098
United States     282171.957
Name: POP, dtype: float64
For column names without spaces, df.POP does the same thing.
4.3.3. Select data by conditions#
Instead of indexing rows and columns using integers and names, we can also obtain a sub-dataframe of our interests that satisfies certain (potentially complicated) conditions.
This section demonstrates various ways to do that.
The most straightforward way is with the [] operator.
df[df.POP >= 20000]
| POP | tcgdp | cc | cg | |
|---|---|---|---|---|
| country | ||||
| Argentina | 37335.653 | 2.950722e+05 | 75.716805 | 5.578804 |
| India | 1006300.297 | 1.728144e+06 | 64.575551 | 14.072206 |
| South Africa | 45064.098 | 2.272424e+05 | 72.718710 | 5.726546 |
| United States | 282171.957 | 9.898700e+06 | 72.347054 | 6.032454 |
To understand what is going on here, notice that df.POP >= 20000 returns a series of boolean values.
df.POP >= 20000
country
Argentina         True
Australia        False
India             True
Israel           False
Malawi           False
South Africa      True
United States     True
Name: POP, dtype: bool
In this case, df[___] takes a series of boolean values and only returns rows with the True values.
Take one more example,
df[df.index.isin(['Argentina', 'India', 'South Africa']) & (df.POP > 40000)]
| POP | tcgdp | cc | cg | |
|---|---|---|---|---|
| country | ||||
| India | 1006300.297 | 1.728144e+06 | 64.575551 | 14.072206 |
| South Africa | 45064.098 | 2.272424e+05 | 72.718710 | 5.726546 |
In fact, there is another way of doing the same thing, with more natural syntax.
df.query("country in ['Argentina', 'India', 'South Africa'] and POP > 40000")
| POP | tcgdp | cc | cg | |
|---|---|---|---|---|
| country | ||||
| India | 1006300.297 | 1.728144e+06 | 64.575551 | 14.072206 |
| South Africa | 45064.098 | 2.272424e+05 | 72.718710 | 5.726546 |
The string is a Python expression that pandas evaluates, when called with df.query.
The syntax inside the string is quite easy to read.
Here’s another example.
Consider this arithmetic operation between different columns.
df[(df.cc + df.cg >= 80) & (df.POP <= 20000)]
| POP | tcgdp | cc | cg | |
|---|---|---|---|---|
| country | ||||
| Malawi | 11801.505 | 5026.221784 | 74.707624 | 11.658954 |
It becomes more readable if we use df.query.
df.query("cc + cg >= 80 and POP <= 20000")
| POP | tcgdp | cc | cg | |
|---|---|---|---|---|
| country | ||||
| Malawi | 11801.505 | 5026.221784 | 74.707624 | 11.658954 |
We can also use df.query to select the country with the largest consumption share cc.
df.query("cc == cc.max()")
| POP | tcgdp | cc | cg | |
|---|---|---|---|---|
| country | ||||
| Argentina | 37335.653 | 295072.21869 | 75.716805 | 5.578804 |
When selecting rows and columns together, we typically use .loc.
For example, in the following code the first argument is the condition and the second is the list of columns we want to return.
df.loc[(df.cc + df.cg >= 80) & (df.POP <= 20000), ['POP', 'tcgdp']]
| POP | tcgdp | |
|---|---|---|
| country | ||
| Malawi | 11801.505 | 5026.221784 |
We can save any selection to a file for further analysis.
df_subset = df[['POP', 'tcgdp']]
df_subset.to_csv('population_and_gdp.csv')
4.3.4. The apply method#
Another widely used pandas method is df.apply().
It applies a function to each row/column and returns a series.
This function can be some built-in functions like the max function, a lambda function, or a user-defined function.
Here is an example using the max function
df.apply(max)
POP      1.006300e+06
tcgdp    9.898700e+06
cc       7.571681e+01
cg       1.407221e+01
dtype: float64
This line of code applies the max function to each column.
A lambda function is often used with df.apply().
For example, this adds the consumption and government shares in each row
df.apply(lambda row: row.cc + row.cg, axis=1)
country
Argentina        81.295610
Australia        74.479124
India            78.647757
Israel           74.703139
Malawi           86.366579
South Africa     78.445257
United States    78.379508
dtype: float64
Note
For the .apply() method
axis = 0 – apply function to each column (variables)
axis = 1 – apply function to each row (observations)
axis = 0 is the default parameter
There is an easier way to add those two shares.
df.cc + df.cg
country
Argentina        81.295610
Australia        74.479124
India            78.647757
Israel           74.703139
Malawi           86.366579
South Africa     78.445257
United States    78.379508
dtype: float64
But apply is useful for more complex operations.
For example, suppose that a donor is deciding which countries can receive aid.
Its rule has two parts:
A country with at most 40 million people qualifies if its GDP per capita is below 10,000 dollars.
A country with more than 40 million people qualifies if its GDP per capita is below 5,000 dollars, because it has more domestic resources to draw on.
We can write this rule as a function that takes one row and returns True or False.
def eligible(row):
    # tcgdp is in millions and POP is in thousands
    gdp_percap = row.tcgdp * 1e3 / row.POP
    limit = 5000 if row.POP > 40_000 else 10_000
    return gdp_percap < limit
Applying this function to each row gives a series of boolean values.
df.apply(eligible, axis=1)
country
Argentina         True
Australia        False
India             True
Israel           False
Malawi            True
South Africa     False
United States    False
dtype: bool
We can use this series with .loc[] to select the eligible countries and the columns we want.
df.loc[df.apply(eligible, axis=1), ['POP', 'tcgdp']]
| POP | tcgdp | |
|---|---|---|
| country | ||
| Argentina | 37335.653 | 2.950722e+05 |
| India | 1006300.297 | 1.728144e+06 |
| Malawi | 11801.505 | 5.026222e+03 |
South Africa misses out because of its size, even though it is poorer than Argentina.
4.3.5. Make changes in DataFrames#
The ability to make changes in dataframes is important to generate a clean dataset for future analysis.
1. We can simply use .loc[] to specify the column that we want to modify, and assign values
For example, suppose we learn that the figure for India’s government share is unreliable.
We can mark it as missing, so that we don’t use it by accident.
df.loc['India', 'cg'] = np.nan
df
| POP | tcgdp | cc | cg | |
|---|---|---|---|---|
| country | ||||
| Argentina | 37335.653 | 2.950722e+05 | 75.716805 | 5.578804 |
| Australia | 19053.186 | 5.418047e+05 | 67.759026 | 6.720098 |
| India | 1006300.297 | 1.728144e+06 | 64.575551 | NaN |
| Israel | 6114.570 | 1.292539e+05 | 64.436451 | 10.266688 |
| Malawi | 11801.505 | 5.026222e+03 | 74.707624 | 11.658954 |
| South Africa | 45064.098 | 2.272424e+05 | 72.718710 | 5.726546 |
| United States | 282171.957 | 9.898700e+06 | 72.347054 | 6.032454 |
2. We can use the .apply() method to modify rows/columns as a whole
For example, suppose we want to report GDP in billions rather than millions.
def update_row(row):
    # convert tcgdp from millions to billions
    row.tcgdp = row.tcgdp / 1000
    return row

df.apply(update_row, axis=1)
| POP | tcgdp | cc | cg | |
|---|---|---|---|---|
| country | ||||
| Argentina | 37335.653 | 295.072219 | 75.716805 | 5.578804 |
| Australia | 19053.186 | 541.804652 | 67.759026 | 6.720098 |
| India | 1006300.297 | 1728.144375 | 64.575551 | NaN |
| Israel | 6114.570 | 129.253894 | 64.436451 | 10.266688 |
| Malawi | 11801.505 | 5.026222 | 74.707624 | 11.658954 |
| South Africa | 45064.098 | 227.242369 | 72.718710 | 5.726546 |
| United States | 282171.957 | 9898.700000 | 72.347054 | 6.032454 |
This returns a new DataFrame, so df itself is unchanged.
3. We can use the .map() method to modify all individual entries in the dataframe altogether.
# Round all decimal numbers to 2 decimal places
df.map(lambda x: round(x, 2))
| POP | tcgdp | cc | cg | |
|---|---|---|---|---|
| country | ||||
| Argentina | 37335.65 | 295072.22 | 75.72 | 5.58 |
| Australia | 19053.19 | 541804.65 | 67.76 | 6.72 |
| India | 1006300.30 | 1728144.37 | 64.58 | NaN |
| Israel | 6114.57 | 129253.89 | 64.44 | 10.27 |
| Malawi | 11801.50 | 5026.22 | 74.71 | 11.66 |
| South Africa | 45064.10 | 227242.37 | 72.72 | 5.73 |
| United States | 282171.96 | 9898700.00 | 72.35 | 6.03 |
4.3.6. Missing values#
Real datasets usually have gaps, which pandas marks with NaN.
So far df has one, India’s government share, so let’s insert a few more.
for idx in list(zip([0, 3, 5, 6], [2, 3, 2, 3])):
    df.iloc[idx] = np.nan

df
| POP | tcgdp | cc | cg | |
|---|---|---|---|---|
| country | ||||
| Argentina | 37335.653 | 2.950722e+05 | NaN | 5.578804 |
| Australia | 19053.186 | 5.418047e+05 | 67.759026 | 6.720098 |
| India | 1006300.297 | 1.728144e+06 | 64.575551 | NaN |
| Israel | 6114.570 | 1.292539e+05 | 64.436451 | NaN |
| Malawi | 11801.505 | 5.026222e+03 | 74.707624 | 11.658954 |
| South Africa | 45064.098 | 2.272424e+05 | NaN | 5.726546 |
| United States | 282171.957 | 9.898700e+06 | 72.347054 | NaN |
The zip() function here creates pairs of values from the two lists (i.e. [0,2], [3,3] …)
The first step is to find the gaps.
The isna method marks each missing value as True, and summing counts them in each column.
df.isna().sum()
POP      0
tcgdp    0
cc       2
cg       3
dtype: int64
One option is to drop every row that has a missing value.
df.dropna()
| POP | tcgdp | cc | cg | |
|---|---|---|---|---|
| country | ||||
| Australia | 19053.186 | 541804.652100 | 67.759026 | 6.720098 |
| Malawi | 11801.505 | 5026.221784 | 74.707624 | 11.658954 |
Notice how much data this loses: only two of the seven countries remain.
Another option is to fill the gaps with a fixed value.
df.fillna(0)
| POP | tcgdp | cc | cg | |
|---|---|---|---|---|
| country | ||||
| Argentina | 37335.653 | 2.950722e+05 | 0.000000 | 5.578804 |
| Australia | 19053.186 | 5.418047e+05 | 67.759026 | 6.720098 |
| India | 1006300.297 | 1.728144e+06 | 64.575551 | 0.000000 |
| Israel | 6114.570 | 1.292539e+05 | 64.436451 | 0.000000 |
| Malawi | 11801.505 | 5.026222e+03 | 74.707624 | 11.658954 |
| South Africa | 45064.098 | 2.272424e+05 | 0.000000 | 5.726546 |
| United States | 282171.957 | 9.898700e+06 | 72.347054 | 0.000000 |
This is clearly wrong here, since no country has a consumption share of zero.
A common alternative is single imputation, which fills each gap with the mean of its column.
df.fillna(df.mean())
| POP | tcgdp | cc | cg | |
|---|---|---|---|---|
| country | ||||
| Argentina | 37335.653 | 2.950722e+05 | 68.765141 | 5.578804 |
| Australia | 19053.186 | 5.418047e+05 | 67.759026 | 6.720098 |
| India | 1006300.297 | 1.728144e+06 | 64.575551 | 7.421101 |
| Israel | 6114.570 | 1.292539e+05 | 64.436451 | 7.421101 |
| Malawi | 11801.505 | 5.026222e+03 | 74.707624 | 11.658954 |
| South Africa | 45064.098 | 2.272424e+05 | 68.765141 | 5.726546 |
| United States | 282171.957 | 9.898700e+06 | 72.347054 | 7.421101 |
None of these calls changes df, since each one returns a new DataFrame.
Missing value imputation is a big area in data science involving various machine learning techniques.
There are also more advanced tools in Python to impute missing values.
4.3.7. New columns, sorting and plotting#
For the rest of this section we only need population (POP) and total GDP (tcgdp), which have no gaps.
df = df[['POP', 'tcgdp']]
df
| POP | tcgdp | |
|---|---|---|
| country | ||
| Argentina | 37335.653 | 2.950722e+05 |
| Australia | 19053.186 | 5.418047e+05 |
| India | 1006300.297 | 1.728144e+06 |
| Israel | 6114.570 | 1.292539e+05 |
| Malawi | 11801.505 | 5.026222e+03 |
| South Africa | 45064.098 | 2.272424e+05 |
| United States | 282171.957 | 9.898700e+06 |
Let’s give the columns slightly better names
df.columns = 'population', 'total GDP'
df
| population | total GDP | |
|---|---|---|
| country | ||
| Argentina | 37335.653 | 2.950722e+05 |
| Australia | 19053.186 | 5.418047e+05 |
| India | 1006300.297 | 1.728144e+06 |
| Israel | 6114.570 | 1.292539e+05 |
| Malawi | 11801.505 | 5.026222e+03 |
| South Africa | 45064.098 | 2.272424e+05 |
| United States | 282171.957 | 9.898700e+06 |
The population variable is in thousands, let’s revert to single units
df['population'] = df['population'] * 1e3
df
| population | total GDP | |
|---|---|---|
| country | ||
| Argentina | 3.733565e+07 | 2.950722e+05 |
| Australia | 1.905319e+07 | 5.418047e+05 |
| India | 1.006300e+09 | 1.728144e+06 |
| Israel | 6.114570e+06 | 1.292539e+05 |
| Malawi | 1.180150e+07 | 5.026222e+03 |
| South Africa | 4.506410e+07 | 2.272424e+05 |
| United States | 2.821720e+08 | 9.898700e+06 |
Next, we’re going to add a column showing real GDP per capita, multiplying by 1,000,000 as we go because total GDP is in millions
df['GDP percap'] = df['total GDP'] * 1e6 / df['population']
df
| population | total GDP | GDP percap | |
|---|---|---|---|
| country | |||
| Argentina | 3.733565e+07 | 2.950722e+05 | 7903.229085 |
| Australia | 1.905319e+07 | 5.418047e+05 | 28436.433261 |
| India | 1.006300e+09 | 1.728144e+06 | 1717.324719 |
| Israel | 6.114570e+06 | 1.292539e+05 | 21138.672749 |
| Malawi | 1.180150e+07 | 5.026222e+03 | 425.896679 |
| South Africa | 4.506410e+07 | 2.272424e+05 | 5042.647686 |
| United States | 2.821720e+08 | 9.898700e+06 | 35080.381854 |
One of the nice things about pandas DataFrame and Series objects is that they have methods for plotting and visualization that work through Matplotlib.
For example, we can easily generate a bar plot of GDP per capita
ax = df['GDP percap'].plot(kind='bar')
ax.set_xlabel('country', fontsize=12)
ax.set_ylabel('GDP per capita', fontsize=12)
plt.show()
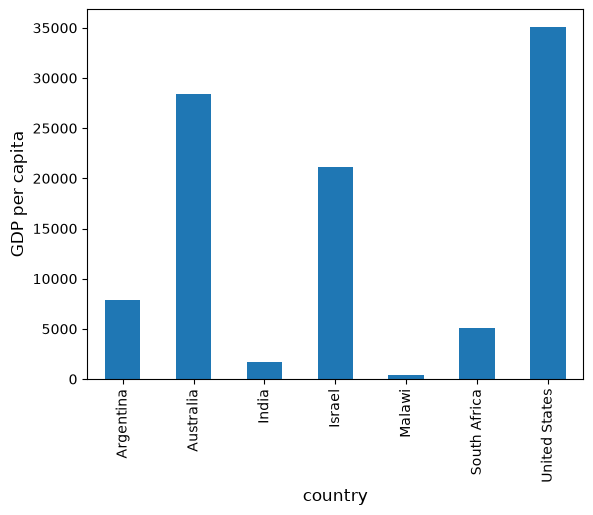
Fig. 4.3 GDP per capita, in alphabetical order#
At the moment the data frame is ordered alphabetically on the countries—let’s change it to GDP per capita
df = df.sort_values(by='GDP percap', ascending=False)
df
| population | total GDP | GDP percap | |
|---|---|---|---|
| country | |||
| United States | 2.821720e+08 | 9.898700e+06 | 35080.381854 |
| Australia | 1.905319e+07 | 5.418047e+05 | 28436.433261 |
| Israel | 6.114570e+06 | 1.292539e+05 | 21138.672749 |
| Argentina | 3.733565e+07 | 2.950722e+05 | 7903.229085 |
| South Africa | 4.506410e+07 | 2.272424e+05 | 5042.647686 |
| India | 1.006300e+09 | 1.728144e+06 | 1717.324719 |
| Malawi | 1.180150e+07 | 5.026222e+03 | 425.896679 |
Plotting as before now yields
ax = df['GDP percap'].plot(kind='bar')
ax.set_xlabel('country', fontsize=12)
ax.set_ylabel('GDP per capita', fontsize=12)
plt.show()
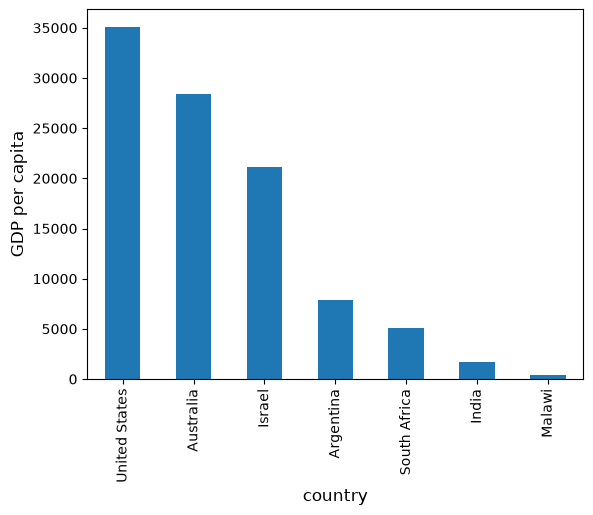
Fig. 4.4 GDP per capita, sorted#
4.3.8. Merging and grouping#
Most real analyses combine data from more than one source.
Suppose we have a second table that assigns each country to a region.
regions = pd.DataFrame({
    'country': ['Argentina', 'Australia', 'India', 'Israel',
                'Malawi', 'South Africa', 'USA'],
    'region': ['Americas', 'Oceania', 'Asia', 'Asia',
               'Africa', 'Africa', 'Americas'],
})
regions
| country | region | |
|---|---|---|
| 0 | Argentina | Americas |
| 1 | Australia | Oceania |
| 2 | India | Asia |
| 3 | Israel | Asia |
| 4 | Malawi | Africa |
| 5 | South Africa | Africa |
| 6 | USA | Americas |
We can combine the two tables with merge, matching rows on the country name.
merged = df.merge(regions, on='country')
merged
| country | population | total GDP | GDP percap | region | |
|---|---|---|---|---|---|
| 0 | Australia | 1.905319e+07 | 5.418047e+05 | 28436.433261 | Oceania |
| 1 | Israel | 6.114570e+06 | 1.292539e+05 | 21138.672749 | Asia |
| 2 | Argentina | 3.733565e+07 | 2.950722e+05 | 7903.229085 | Americas |
| 3 | South Africa | 4.506410e+07 | 2.272424e+05 | 5042.647686 | Africa |
| 4 | India | 1.006300e+09 | 1.728144e+06 | 1717.324719 | Asia |
| 5 | Malawi | 1.180150e+07 | 5.026222e+03 | 425.896679 | Africa |
The result has country as an ordinary column again, with a new integer index.
Now look closely at the rows: the United States has disappeared.
The second table calls it USA, so the row has no match, and by default merge keeps only the rows that match.
No error or warning tells us this has happened.
One useful habit is to compare the number of rows before and after a merge.
print(len(df), len(merged))
7 6
Another is to use how='left', which keeps every row of the first table and shows the gap as NaN.
df.merge(regions, on='country', how='left')
| country | population | total GDP | GDP percap | region | |
|---|---|---|---|---|---|
| 0 | United States | 2.821720e+08 | 9.898700e+06 | 35080.381854 | NaN |
| 1 | Australia | 1.905319e+07 | 5.418047e+05 | 28436.433261 | Oceania |
| 2 | Israel | 6.114570e+06 | 1.292539e+05 | 21138.672749 | Asia |
| 3 | Argentina | 3.733565e+07 | 2.950722e+05 | 7903.229085 | Americas |
| 4 | South Africa | 4.506410e+07 | 2.272424e+05 | 5042.647686 | Africa |
| 5 | India | 1.006300e+09 | 1.728144e+06 | 1717.324719 | Asia |
| 6 | Malawi | 1.180150e+07 | 5.026222e+03 | 425.896679 | Africa |
The figure below shows both merges, with the unmatched rows highlighted.
Blue cells come from df and green cells come from regions.
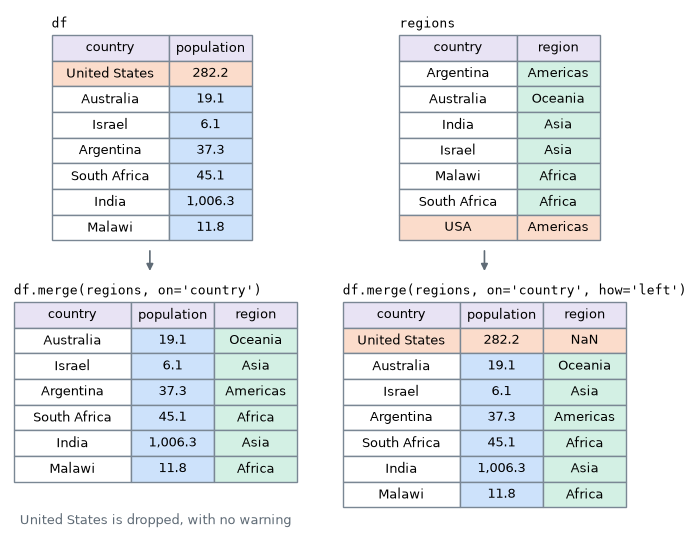
Fig. 4.5 Two ways to merge, with population in millions#
Let’s fix the name and merge again.
regions['country'] = regions['country'].replace('USA', 'United States')
merged = df.merge(regions, on='country')
merged
| country | population | total GDP | GDP percap | region | |
|---|---|---|---|---|---|
| 0 | United States | 2.821720e+08 | 9.898700e+06 | 35080.381854 | Americas |
| 1 | Australia | 1.905319e+07 | 5.418047e+05 | 28436.433261 | Oceania |
| 2 | Israel | 6.114570e+06 | 1.292539e+05 | 21138.672749 | Asia |
| 3 | Argentina | 3.733565e+07 | 2.950722e+05 | 7903.229085 | Americas |
| 4 | South Africa | 4.506410e+07 | 2.272424e+05 | 5042.647686 | Africa |
| 5 | India | 1.006300e+09 | 1.728144e+06 | 1717.324719 | Asia |
| 6 | Malawi | 1.180150e+07 | 5.026222e+03 | 425.896679 | Africa |
Now we can use the new column with groupby, which splits the rows into groups and computes something for each one.
For example, here is the total population of each region, in millions.
merged.groupby('region')['population'].sum() / 1e6
region
Africa        56.865603
Americas     319.507610
Asia        1012.414867
Oceania       19.053186
Name: population, dtype: float64
The figure below shows the steps: the rows are split by region, each group is summed, and the results are combined into one table.
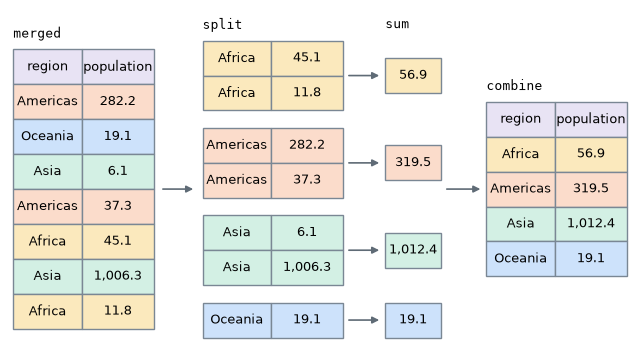
Fig. 4.6 Split, sum and combine, with population in millions#
4.3.9. Silent failures#
Code that runs without an error message can still give the wrong answer.
The merge that lost the United States is one example.
Here is another.
Suppose that Argentina’s population is missing, and that we fill the gap with the mean, just as we did for missing values above.
raw = pd.read_csv(url).set_index('country')
raw.loc['Argentina', 'POP'] = np.nan
filled = raw.fillna(raw.mean())

# tcgdp is in millions and POP is in thousands
gdp_percap = filled['tcgdp'] * 1e3 / filled['POP']

comparison = df[['GDP percap']].copy()
comparison['with imputed population'] = gdp_percap
comparison
| GDP percap | with imputed population | |
|---|---|---|
| country | ||
| United States | 35080.381854 | 35080.381854 |
| Australia | 28436.433261 | 28436.433261 |
| Israel | 21138.672749 | 21138.672749 |
| Argentina | 7903.229085 | 1291.810333 |
| South Africa | 5042.647686 | 5042.647686 |
| India | 1717.324719 | 1717.324719 |
| Malawi | 425.896679 | 425.896679 |
Argentina’s GDP per capita is now far too low, because India and the United States pull the mean population well above Argentina’s true population.
Nothing warned us: the code ran, the result looks like any other table, and no missing values remain to show that something was changed.
Filling in a missing value is a modeling choice, and every number computed from that value inherits its error.
4.4. Online data sources#
Someone has to collect every number that we analyze.
Most data used in policy work is produced by national statistical agencies, central banks and international organizations, using surveys, censuses and administrative records such as tax filings.
Before using a series, it is worth asking who produced it, how it was measured and whether it has been revised.
Many of these sources can be read directly from Python.
4.4.1. FRED#
FRED is a vast collection of time series data maintained by the St. Louis Fed.
For example, it holds the US unemployment rate, which the Bureau of Labor Statistics estimates from a monthly household survey.
Since read_csv accepts a URL, reading this series takes one line.
fred_url = 'https://fred.stlouisfed.org/graph/fredgraph.csv?id=UNRATE'
data = pd.read_csv(fred_url, index_col=0, parse_dates=True)
data.head()
| UNRATE | |
|---|---|
| observation_date | |
| 1948-01-01 | 3.4 |
| 1948-02-01 | 3.8 |
| 1948-03-01 | 4.0 |
| 1948-04-01 | 3.9 |
| 1948-05-01 | 3.5 |
Here index_col=0 makes the first column the index, and parse_dates=True tells pandas that it holds dates.
Because the index holds dates, we can select a range of years with .loc.
ax = data.loc['2006':'2012'].plot(legend=False, lw=2)
ax.set_xlabel('year', fontsize=12)
ax.set_ylabel('unemployment rate (%)', fontsize=12)
plt.show()
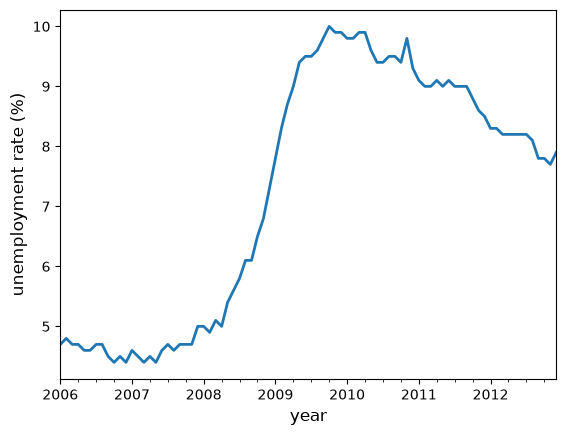
Fig. 4.7 US unemployment rate#
pandas can also read many other formats, including Excel, JSON and Parquet files, and it can connect to databases.
4.4.2. The World Bank#
The World Bank collects and organizes data on a huge range of indicators.
The wbgapi library can fetch data from its databases, and this blog post gives an introduction.
For example, here’s some data on government debt as a ratio to GDP.
import wbgapi as wb
wb.series.info('GC.DOD.TOTL.GD.ZS')
| id | value |
|---|---|
| GC.DOD.TOTL.GD.ZS | Central government debt, total (% of GDP) |
| 1 elements |
The next code fetches the data and plots time series for the US and Australia.
govt_debt = wb.data.DataFrame('GC.DOD.TOTL.GD.ZS',
                              economy=['USA', 'AUS'],
                              time=range(2005, 2016))
govt_debt = govt_debt.T    # move years from columns to rows for plotting
ax = govt_debt.plot(lw=2)
ax.set_xlabel('year', fontsize=12)
ax.set_ylabel('government debt (% of GDP)', fontsize=12)
plt.show()
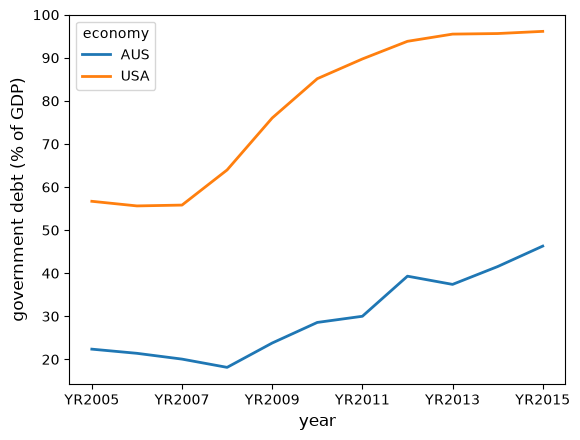
Fig. 4.8 Government debt as a ratio to GDP#
4.5. Exercises#
Exercise 4.1
You ask an AI tool to analyze the country data in gdp_population_by_country_2000.csv, and it returns the code below.
table = pd.read_csv(url).set_index('country')
table = table.query("cg > cg.mean()")
table = table.loc[:, ['POP', 'cg']].sort_values('cg', ascending=False)
table
Without running the code, say in one sentence what table it produces.
Then run it to check your answer.
Solution
The code lists the countries whose government share is above the average of the seven countries, showing their population and government share, with the largest share first.
table = pd.read_csv(url).set_index('country')
table = table.query("cg > cg.mean()")
table = table.loc[:, ['POP', 'cg']].sort_values('cg', ascending=False)
table
| POP | cg | |
|---|---|---|
| country | ||
| India | 1006300.297 | 14.072206 |
| Malawi | 11801.505 | 11.658954 |
| Israel | 6114.570 | 10.266688 |
Exercise 4.2
You ask an AI tool for the total GDP of each region, and it returns the code below.
gdp = pd.read_csv(url)
regions = pd.DataFrame({
    'country': ['Argentina', 'Australia', 'India', 'Israel', 'Israel',
                'Malawi', 'South Africa', 'United States'],
    'region': ['Americas', 'Oceania', 'Asia', 'Asia', 'Middle East',
               'Africa', 'Africa', 'Americas'],
})
merged = gdp.merge(regions, on='country')
merged.groupby('region')['tcgdp'].sum()
The code runs without an error.
Can you trust the answer?
Find the problem and fix it.
Solution
As in the lecture, we start by comparing the number of rows before and after the merge.
gdp = pd.read_csv(url)
regions = pd.DataFrame({
    'country': ['Argentina', 'Australia', 'India', 'Israel', 'Israel',
                'Malawi', 'South Africa', 'United States'],
    'region': ['Americas', 'Oceania', 'Asia', 'Asia', 'Middle East',
               'Africa', 'Africa', 'Americas'],
})
merged = gdp.merge(regions, on='country')
print(len(gdp), len(merged))
7 8
The merge has added a row, so some country must appear twice in regions.
regions[regions['country'].duplicated(keep=False)]
| country | region | |
|---|---|---|
| 3 | Israel | Asia |
| 4 | Israel | Middle East |
Israel is listed under two regions, so its GDP is counted twice and the regional totals add up to more than the total GDP of the seven countries.
print(gdp['tcgdp'].sum(), merged['tcgdp'].sum())
12825243.7310936 12954497.6253236
To fix this, we give each country one region.
Which region to use for Israel is a judgment call, and here we choose Asia.
We also pass validate='many_to_one', which makes merge raise an error if a country appears twice in regions.
regions = regions[regions['region'] != 'Middle East']
merged = gdp.merge(regions, on='country', validate='many_to_one')
merged.groupby('region')['tcgdp'].sum()
region
Africa      2.322686e+05
Americas    1.019377e+07
Asia        1.857398e+06
Oceania     5.418047e+05
Name: tcgdp, dtype: float64
Exercise 4.3
Using the corrected merged table from Exercise 4.2, compute GDP per capita for each region in two ways:
the average of GDP per capita across the countries in the region
the total GDP of the region divided by its total population
You can write this yourself or ask an AI tool to do it.
Why are the two answers so different for Asia?
Which one would you report, and when?
Solution
Here is one way to compute both.
merged['gdp_percap'] = merged['tcgdp'] * 1e3 / merged['POP']
average = merged.groupby('region')['gdp_percap'].mean()

totals = merged.groupby('region')[['tcgdp', 'POP']].sum()
whole_region = totals['tcgdp'] * 1e3 / totals['POP']

pd.DataFrame({'average of countries': average,
              'region as a whole': whole_region})
| average of countries | region as a whole | |
|---|---|---|
| region | ||
| Africa | 2734.272182 | 4084.518215 |
| Americas | 21491.805469 | 31904.630436 |
| Asia | 11427.998734 | 1834.621685 |
| Oceania | 28436.433261 | 28436.433261 |
The average of countries gives India and Israel equal weight, even though India has more than 160 times as many people.
The second number is close to India’s own figure, because India makes up nearly all of the region’s population.
Neither answer is wrong, because they answer different questions, as in Reading Python and Directing AI.
The first describes a typical country, while the second describes the income of a typical person.